eBPF is a virtual machine, similar in concept to the JVM, except it’s inside the Linux kernel. It lets you write C-like code, compile it, and load the byte code into the kernel. You can then attach hooks to your loaded eBPF program to trigger it to run. Those hooks could be things like system calls, kprobes, or uprobes.
There’s many use cases for eBPF. Considering eBPF programs have full system visibility there are very few limits on what you can do. You can write an eBPF program which logs every time certain files are modified. You use eBPF to profile performance of your other programs. You can implement host-based networking rules, or use it for writing malware.
I have become obsessed with eBPF. In particular the most interesting functionality to me is the ability to attach eBPF programs to uprobes. These are a seperate technology from eBPF but they play very well together. Uprobes let you create a hook at a memory address anywhere in userspace. That means after you compile a program, let’s say one written in Go, you can attach a hook to a specified function inside that program. Let’s look at an example:
package main

func functionA() {
    ...
}

func main() {
    functionA()
}
When you go build it, functionA() is created as a symbol in the created binary. We can see it here with this command:
[*] objdump --syms ./test | grep functionA
0000000000452330 g     F .text	0000000000000001 main.functionA
objdump is used to list all the symbols in the binary. In the above output just worry about the memory offset all the way to the left, and the fact that it corresponds to our function main.functionA. (Check out my other post, ‘Dissecting Go Binaries’ for more info on this.)
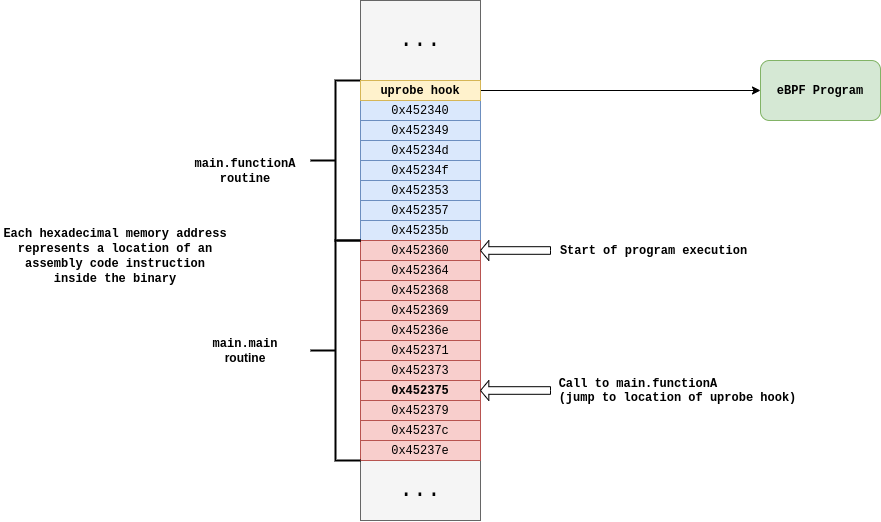
So in this case, you can attach a uprobe to the functionA symbol, which you can have trigger an eBPF program. The uprobe is copied into memory anytime the binary is executed, meaning it will trigger anytime any process runs that function. Here’s a diagram to help better visualize this:
Let’s write some eBPF
The best way to instrument eBPF programs is using a library called bcc which has bindings for high level languages like Go or Python. It lets you load, run, and receive output from eBPF programs to your userspace program. You can think of it as a compiler and runtime that you can use as a Go package.
Take the following example Go program that we’re going to trace:
package main

import (
	"fmt"
	"log"
	"net/http"
)

//go:noinline
func handlerFunction(w http.ResponseWriter, r *http.Request) {
	fmt.Fprintf(w, "Hi there from %s!", r.Host)
}

func main() {
	http.HandleFunc("/", handlerFunction)
	log.Fatal(http.ListenAndServe(":8080", nil))
}
This is just a simple webserver that serves a polite greeting. Doing a curl localhost:8080 or going to localhost:8080 in your browser will hit the endpoint.
We’re going to use eBPF and uprobes to tell us every time the function handlerFunction is called, and therefore every time someone connects to our webserver.
The eBPF program is going to be triggered every time handlerFunction is called. We’re going to keep things simple, so the only thing it’s actually going to do is send a message to our Go program saying “Hey, the handler was called!”. Let’s look and then break it down:
#include <uapi/linux/ptrace.h>
#include <linux/string.h>

BPF_PERF_OUTPUT(events);

inline int function_was_called(struct pt_regs *ctx) {

   char x[29] = "Hey, the handler was called!";
   events.perf_submit(ctx, &x, sizeof(x));
   return 0;
}
Just a couple things to note here. First off, we need a way for the eBPF program to tell us that it was triggered (meaning the handler was called in the Go program that we’re tracing). To accomplish this, we use a perf output buffer. We can send arbitrary data over it from eBPF, and read it in the Go program which loaded it. We create this table using the helper function BPF_PERF_OUTPUT, which takes one parameter, the name of the table we want to create. You can see it then being used with the call: events.perf_submit(...). That call just sends the string that we have hardcoded through it.
For now you can ignore the pt_regs ctx parameter, more on that in part two.
Now let’s write some Go code. We’re going to use bcc to compile the above eBPF code, load it, and then listen for output.
bpfModule := bcc.NewModule(eBPF_Text, []string{}) // We're going to store the eBPF program above in a string, named eBPF_Text

uprobeFd, err := bpfModule.LoadUprobe("function_was_called")
if err != nil {
	log.Fatal(err)
}
All we’re doing above is creating a new module (not a kernel module) by passing in the text of our eBPF program which is kept in a string. We’re then creating a new uprobe which we’re going to attach the eBPF function function_was_called.
err = bpfModule.AttachUprobe(pathToBinaryToTrace, "main.handlerFunction", uprobeFd, -1)
if err != nil {
	log.Fatal(err)
}
Uprobes attach to userspace memory locations. In order to do this we give AttachUprobe a path to the binary that contains the symbol "main.handlerFunction". This helper function will figure out the exact memory address within the binary for us. Whenever the binaries executable code section is mapped into memory, so will the uprobe.
table := bcc.NewTable(bpfModule.TableId("events"), bpfModule)

outputChannel := make(chan []byte)

perfMap, err := bcc.InitPerfMap(table, outputChannel)
if err != nil {
	log.Fatal(err)
}
Next we set up the perf output buffer on the Go userspace side. We’ll interact with it in an idiomatic Go way, through a simple channel.
perfMap.Start()
defer perfMap.Stop()

for {
	value := <-channel
	fmt.Println(string(value))
}
The above code just prints output as it comes in, and that’s it.
Now if we run our webserver, then run our tracing eBPF/Go program (or in reverse order, doesn’t matter), the tracing program will let us know every time someone hits the webserver!
Here’s a demo recording:

Code for the: webserver and tracer
Next steps
In the next part of this series we’re going to learn about how we can extract a lot more information using eBPF. Things like function arguments, calling process information, and more!